Introduction: Building Real-Time Data Pipelines with n8n and Airbyte
Imagine a world where your business dashboards always reflect the very latest information, allowing you to make critical decisions with confidence and speed. That's the power of real-time data synchronization, and it's becoming essential for businesses that want to stay ahead in today's fast-paced environment. No more waiting for overnight batch updates – with the right tools, you can gain immediate insights from your data.
The Modern Analytics Stack: A Real-Time Dream Team
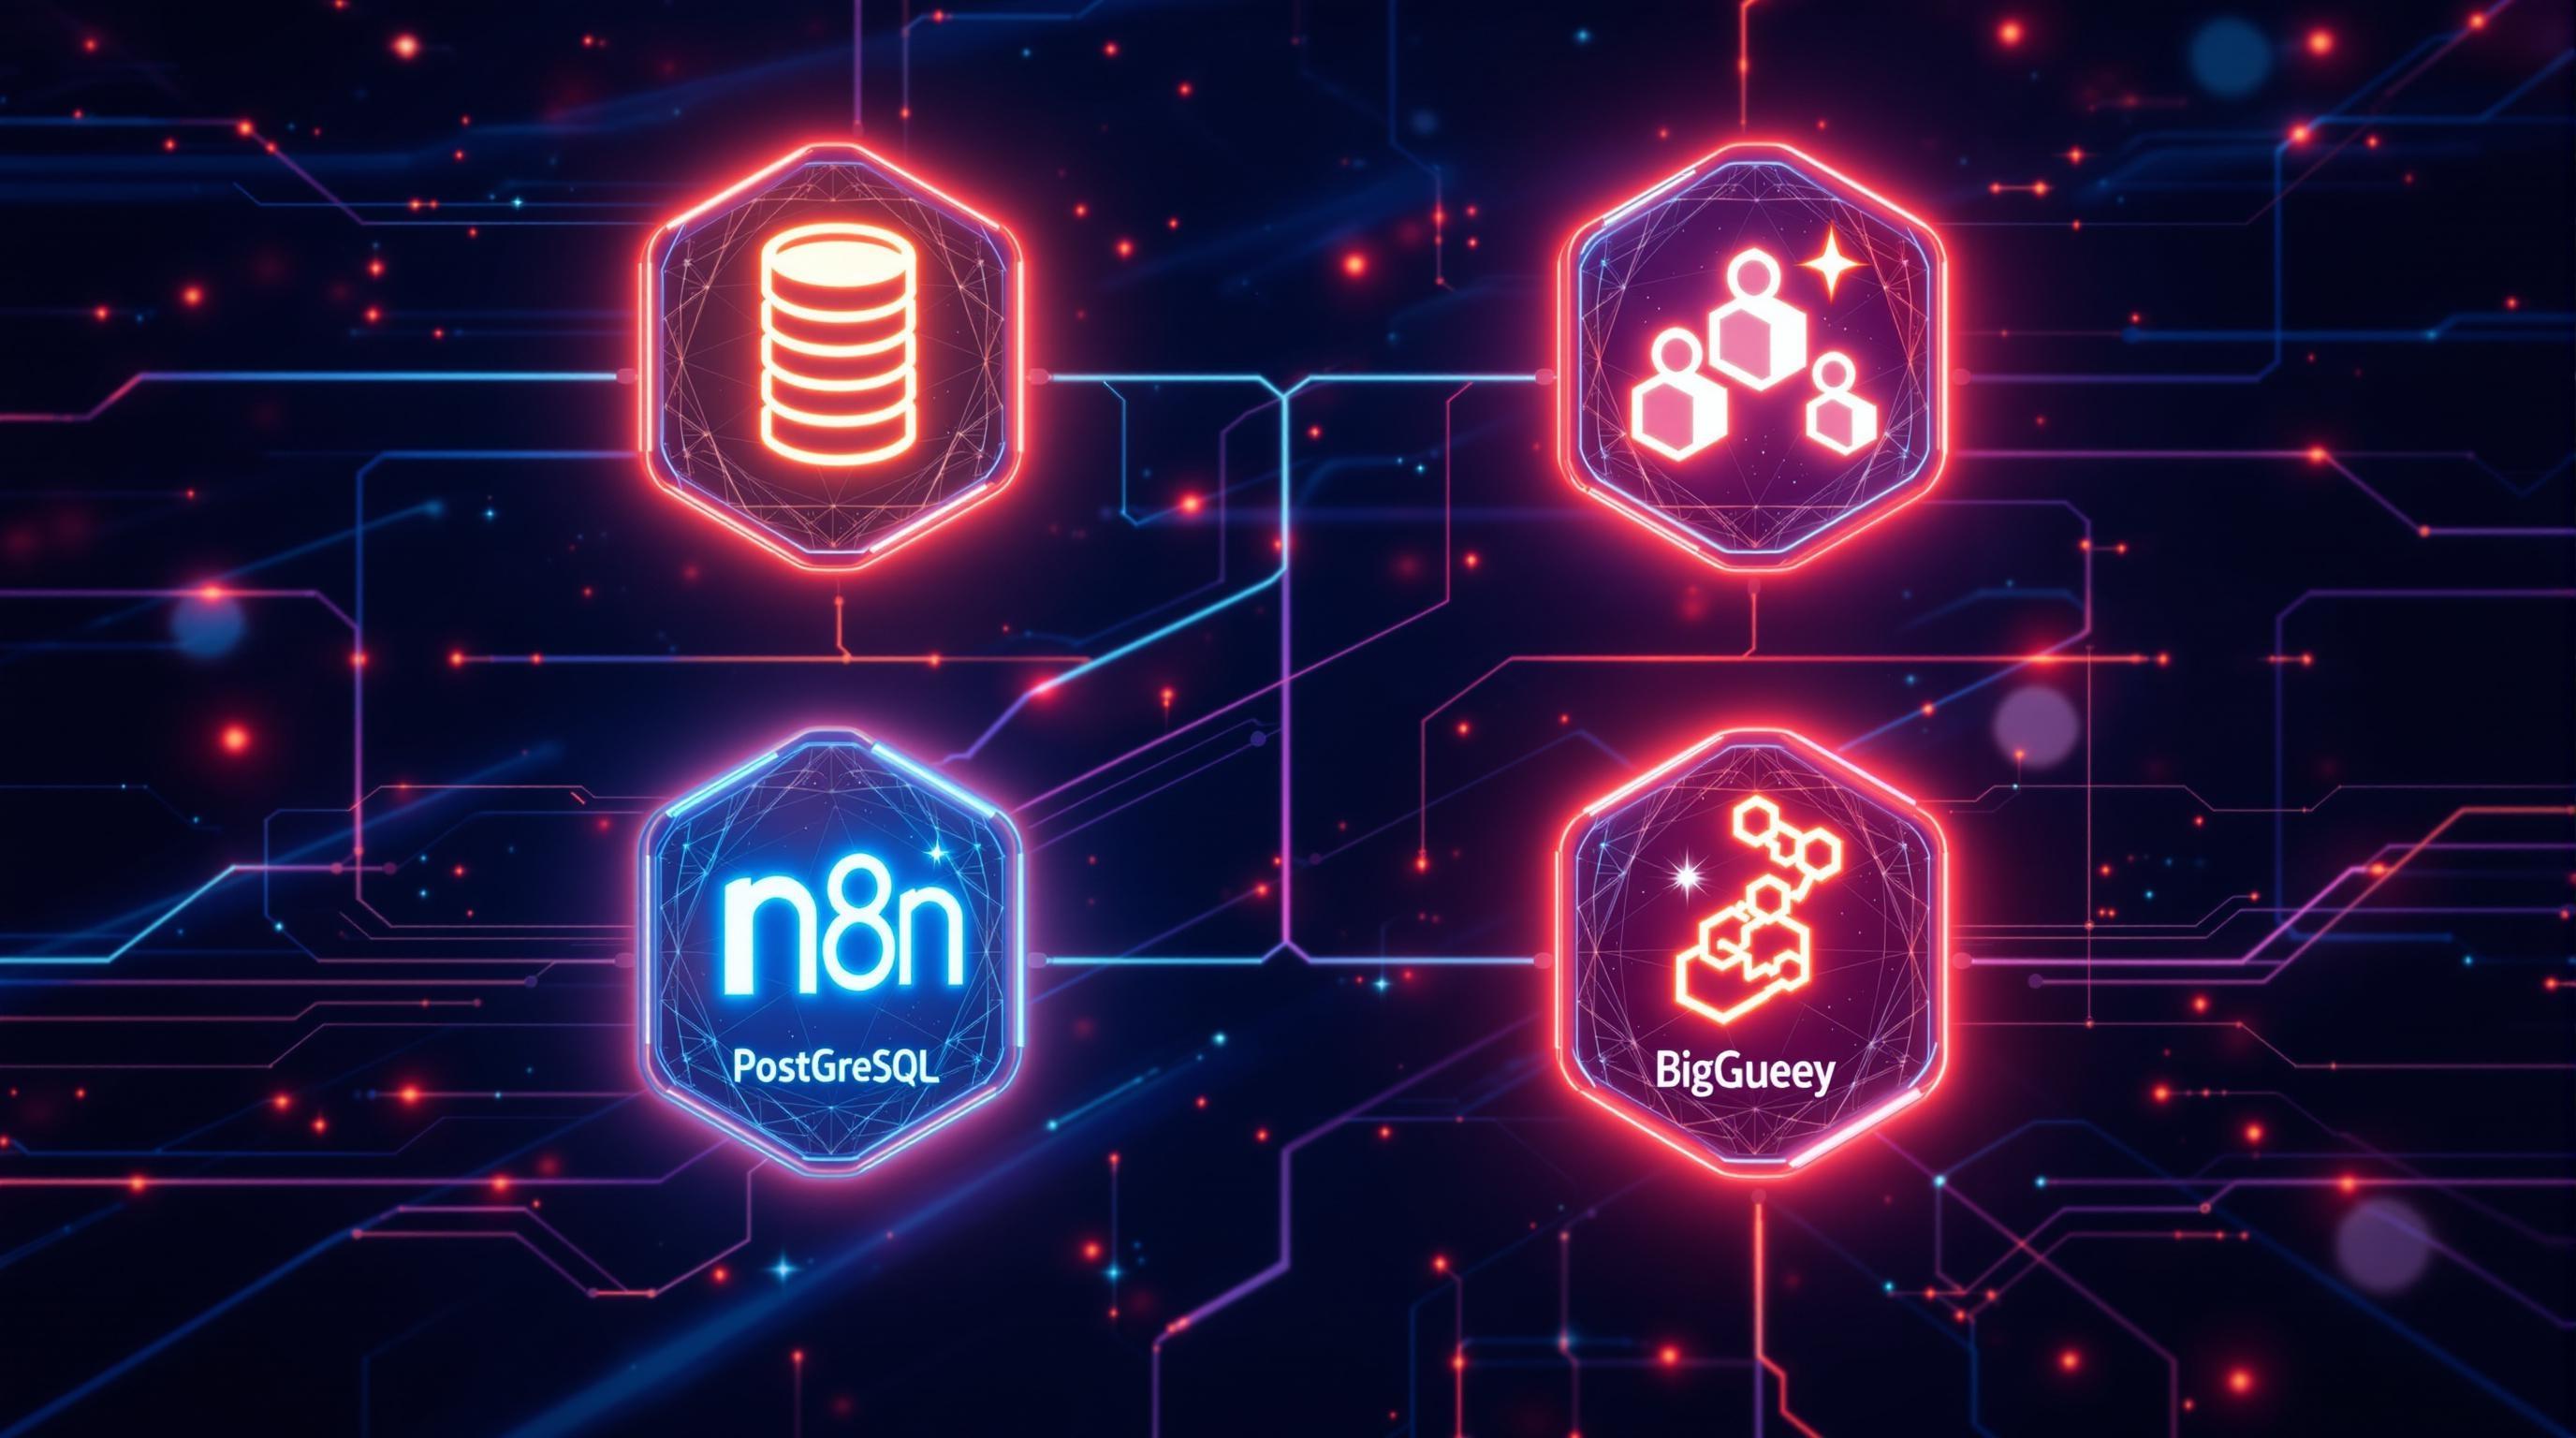
We're going to explore how to build a powerful real-time data pipeline using a specific tech stack, designed for efficiency and scalability. This stack includes:
PostgreSQL: A robust and widely-used open-source relational database, serving as our primary data source. PostgreSQL is known for its reliability and support for complex data types, making it a great foundation for many applications.
Airbyte: An open-source data integration platform that specializes in Change Data Capture (CDC). Airbyte simplifies the process of extracting data changes from PostgreSQL in real-time, ensuring that only the updated information is moved, rather than the entire dataset each time.
n8n: A flexible and extensible workflow automation platform. In our pipeline, n8n orchestrates the entire data flow, connecting Airbyte's data stream to BigQuery. Think of it as the conductor of an orchestra, ensuring all the instruments play in harmony.
BigQuery: Google's fully-managed, serverless data warehouse, designed for large-scale data analytics. BigQuery provides the speed and scalability required to analyze real-time data effectively, powering your dashboards and reports.
This combination allows us to capture changes in our PostgreSQL database, transform them as needed, and load them into BigQuery for near-instantaneous analysis. It's a powerful recipe for data-driven decision-making.

Why This Architecture Matters: Minimizing Latency, Maximizing Insight
So, why go through the effort of building this type of Airbyte n8n real-time sync pipeline? The benefits are significant:
Minimized Latency: Access the freshest possible data, enabling timely decision-making. Imagine a stock trading platform that updates in real-time vs. one that's delayed by several minutes – the difference can be substantial. Similarly, for e-commerce, seeing up-to-the-minute sales figures allows for rapid adjustments to marketing campaigns or inventory management.
Reduced Engineering Effort: Airbyte and n8n offer pre-built connectors and visual workflow design, significantly reducing the amount of custom coding required. This frees up your engineering team to focus on more strategic initiatives, rather than spending their time writing and maintaining complex data integration scripts.
Full Observability: n8n provides a clear view of the data pipeline's execution, making it easy to monitor performance, identify bottlenecks, and troubleshoot issues. This level of visibility is crucial for ensuring the reliability and stability of your real-time data synchronization.
By embracing this modern approach to data integration, you can unlock new levels of agility and insight. You're not just moving data; you're empowering your business to react faster, make smarter choices, and gain a competitive edge. Let's dive into the specifics of setting up this powerful pipeline, starting with configuring Airbyte to capture changes from our PostgreSQL database.
Prerequisites: Setting Up Your Environment for Real-Time Data Sync
Ready to dive into real-time data syncing from PostgreSQL to BigQuery using Airbyte and n8n? First, let's ensure your environment is primed and ready for action. This section walks you through the crucial prerequisites that will set the stage for a seamless data pipeline. We'll cover everything from self-hosting n8n to configuring your Google Cloud project. By the end, you'll have all the necessary pieces in place to build a robust and efficient data syncing solution.
Self-Hosting n8n with Docker
n8n is the workflow automation platform that will orchestrate our data movement, and for this Postgres CDC n8n tutorial, we'll leverage Docker for a consistent and isolated environment. If you're unfamiliar, n8n is a powerful workflow automation tool that lets you connect different apps and services to automate tasks. Version 1.21 or higher is recommended to take advantage of the latest features and bug fixes. Here's what you need to do:
Install Docker: If you haven't already, download and install Docker Desktop for your operating system. Docker provides the containerization technology that makes n8n self-hosting a breeze. Think of Docker as a lightweight virtual machine, ensuring your n8n instance runs consistently regardless of the underlying system.
Docker Compose (Optional but Recommended): Docker Compose simplifies the process of defining and managing multi- Docker applications. It allows you to define your entire n8n setup in a single
docker-compose.ymlfile, making it easier to start, stop, and scale your n8n instance. A sampledocker-compose.ymlfile might look like this:version: '3.9' services: n8n: image: n8nio/n8n ports: - "5678:5678" volumes: - ./data:/home/node/.n8n environment: - N8N_HOST=localhost - N8N_PORT=5678Start n8n: With Docker and (optionally) Docker Compose set up, you can now start your n8n instance. If using Docker Compose, simply run
docker-compose up -din the directory containing yourdocker-compose.ymlfile. Otherwise, use thedocker runcommand with the appropriate parameters to map ports and volumes. Once n8n is running, you can access it in your web browser athttp://localhost:5678(or the configured host and port).
Running Airbyte for PostgreSQL CDC
Next up is Airbyte, which will handle the Change Data Capture (CDC) from your PostgreSQL database. Airbyte is an open-source data integration platform that simplifies the process of extracting data from various sources and loading it into data warehouses, data lakes, and databases. Make sure you have a running Airbyte instance configured to capture changes from your PostgreSQL database using CDC. This involves:
Airbyte Installation: Deploy Airbyte using Docker, Kubernetes, or a cloud provider. Follow the official Airbyte documentation for detailed installation instructions. The specific method will depend on your infrastructure preferences.
PostgreSQL Source Connector: Configure a PostgreSQL source connector in Airbyte, ensuring that it's set up to use CDC. This typically involves providing the database connection details, enabling logical replication in PostgreSQL, and specifying the publication name. Logical replication is a PostgreSQL feature that allows you to stream changes from a database to other systems.
Connection Verification: Verify that Airbyte can successfully connect to your PostgreSQL database and capture changes. This usually involves running a test connection and inspecting the Airbyte logs for any errors.
Google Cloud Project and BigQuery Setup
Our destination is Google Cloud AI, specifically BigQuery. This requires a Google Cloud project with a BigQuery dataset created. Here's the breakdown:
Google Cloud Project: If you don't already have one, create a new project in the Google Cloud Console. This project will serve as the for all your Google Cloud resources, including BigQuery datasets and service accounts.
BigQuery API Enabled: Ensure the BigQuery API is enabled for your project. You can do this by searching for "BigQuery API" in the Google Cloud Console and enabling it.
BigQuery Dataset: Create a BigQuery dataset within your project. A dataset is a for tables, views, and other data assets. Choose a meaningful name for your dataset, such as
postgres_cdc_data. You'll also need to select a location for your dataset, such asUSorEU.
Environment Variables and API Keys
Finally, to glue everything together, you'll need to configure the necessary environment variables and API keys. This typically includes:
Google Cloud Credentials: Generate a service account key in JSON format with the necessary permissions to write to your BigQuery dataset. Store this key securely and reference it in your n8n workflow. The service account should have the
BigQuery Data Editorrole at a minimum.Airbyte Connection Details: Store the Airbyte API endpoint and authentication token as environment variables. Your n8n workflow will use these credentials to interact with the Airbyte API and trigger data synchronization jobs.
n8n Credentials: Configure n8n to use the appropriate database credentials and other settings. This may involve setting environment variables such as
N8N_BASIC_AUTH_USERandN8N_BASIC_AUTH_PASSWORDfor basic authentication.
Here's an example of how you might configure these environment variables in your n8n workflow:
// Get the Airbyte API endpoint from an environment variable
const airbyteApiEndpoint = $parameter.AIRBYTE_API_ENDPOINT;

// Get the Google Cloud service account key from an environment variable
const googleCloudCredentials = JSON.parse($parameter.GOOGLE_CLOUD_CREDENTIALS);
With these prerequisites in place, you're now well-equipped to start building your real-time data pipeline. Having a properly configured environment is half the battle, setting you up for success as you move forward. Now, let's delve into the actual workflow creation and data transformation within n8n.
Step 1: Configuring Airbyte Connector for PostgreSQL CDC
Embarking on the journey of real-time data synchronization begins with setting up the essential components, and our first stop is configuring the Airbyte connector for PostgreSQL using Change Data Capture (CDC). Let's dive in!
Navigating the Airbyte UI: PostgreSQL as the Data Source
The first step in building our data pipeline is configuring PostgreSQL as the data source within the Airbyte UI. Think of Airbyte as the conductor of our data orchestra, and PostgreSQL is the section providing the melodies. To initiate this, navigate to your Airbyte dashboard and select "Add a source." From the list of available connectors, choose PostgreSQL. This action prompts a configuration panel where you'll input your PostgreSQL instance's connection details. These details typically include the host address, port number, database name, username, and password. Accuracy here is crucial—it's like ensuring all instruments are properly tuned before the performance. Once you've entered these details, Airbyte will test the connection to ensure it can successfully communicate with your PostgreSQL database. A successful connection test is your green light to proceed.
Setting Up a Webhook Destination in Airbyte
Next, we'll establish a Webhook as the destination in Airbyte. Webhooks are like messengers, instantly delivering updates as soon as changes occur in your PostgreSQL database. To configure this, select "Add a destination" in Airbyte and choose "Webhook" from the list. You'll need to provide the URL where Airbyte will send the data. This URL is where n8n, our workflow automation tool, will be listening for incoming data. Think of it as giving Airbyte the address to deliver the package. Additional configurations may include setting up authentication headers or specifying the HTTP method (usually POST). With the webhook destination configured, Airbyte knows where to send the captured data, ensuring a seamless flow of information to our n8n workflow.
Enabling Change Data Capture (CDC) in PostgreSQL
Enabling Change Data Capture (CDC) in PostgreSQL is akin to installing a high-resolution security camera that records every data modification. CDC allows Airbyte to capture row-level changes as they happen, without requiring full table scans. To enable CDC, you'll need to create a logical replication slot in PostgreSQL. This slot acts as a bookmark, tracking the changes made to your database. First, ensure that your wal_level parameter in PostgreSQL is set to logical. Then, create a replication slot using the pg_create_logical_replication_slot function. For example:
SELECT pg_create_logical_replication_slot('airbyte_slot', 'pgoutput');This command creates a replication slot named airbyte_slot using the pgoutput plugin. This plugin formats the changes in a way that Airbyte can understand. Once the replication slot is created, Airbyte can connect to it and start receiving a continuous stream of changes. Activating CDC transforms our data pipeline from a periodic snapshot to a real-time feed, ensuring our BigQuery data warehouse is always up-to-date.
JSON Example of Airbyte Configuration File Structure
To illustrate the configuration structure, here’s a JSON example of how your Airbyte connector might look. This is similar to a blueprint, providing the necessary details in a structured format.
{
  "name": "PostgreSQL to Webhook",
  "source": {
    "type": "postgres",
    "host": "your_postgres_host",
    "port": 5432,
    "database": "your_database_name",
    "username": "your_username",
    "password": "your_password",
    "replication_slot": "airbyte_slot",
    "publication": "airbyte_publication"
  },
  "destination": {
    "type": "webhook",
    "url": "your_webhook_url",
    "method": "POST",
    "auth": {
      "type": "header",
      "header": "Authorization",
      "value": "Bearer your_token"
    }
  },
  "streams": [
    {
      "name": "your_table_name",
      "sync_mode": "cdc"
    }
  ]
}
This JSON configuration outlines the essential parameters for both the source (PostgreSQL) and the destination (Webhook). It specifies the connection details, replication slot, and publication for PostgreSQL, as well as the URL, method, and authentication for the Webhook. The streams section indicates which tables to synchronize using CDC. Understanding this structure is vital for customizing and troubleshooting your Airbyte data connector.
By meticulously configuring the Airbyte connector, enabling CDC, and setting up a webhook destination, we establish a robust foundation for our real-time data pipeline. This groundwork ensures that every change in PostgreSQL is captured and ready for the next step: transforming and loading the data into BigQuery using n8n. Let's move on to orchestrating the workflow in n8n!

Step 2: Receiving Airbyte Webhooks in n8n
Now that we've successfully configured Airbyte to capture changes from our PostgreSQL database, the next step is to set up n8n to listen for and process these updates in real-time. This involves creating a webhook in n8n that can receive Airbyte's change data capture (CDC) events.
Creating the "Airbyte-CDC" Webhook Node in n8n
First, open your n8n workflow and add a new Webhook node. This node will act as the entry point for data coming from Airbyte. Name this node something descriptive, like "Airbyte-CDC," to easily identify its purpose within your workflow. Configuring a webhook in n8n is like setting up a dedicated phone line for Airbyte to call whenever there's new data.
Select the POST method for the webhook, as Airbyte will send data to n8n using HTTP POST requests.
Generate a unique Webhook URL. N8n will provide you with a URL that you'll need to configure in Airbyte (as we will see in the next step).
Keep the Authentication setting to "None" for simplicity. However, for production environments, consider implementing authentication for enhanced security.
Mapping Airbyte's JSON Payload into n8n's Data Object
Airbyte sends data as a JSON payload. To effectively use this data in n8n, you need to map the relevant fields from Airbyte's JSON structure to n8n's internal data structure. This mapping allows you to access specific data elements (like the updated row data) within subsequent nodes in your n8n workflow. Think of it like translating a document from one language to another, ensuring the key information is accurately conveyed.
This mapping can be achieved using n8n's expression editor or by writing custom JavaScript code within a Function node. For example, assuming Airbyte sends data in the following format:
{
  "type": "record",
  "namespace": "public",
  "name": "users",
  "data": {
    "id": 123,
    "name": "John Doe",
    "email": "john.doe@example.com"
  }
}
You could use a Function node to extract the data field and make it the main data object for the rest of the workflow. Here's an example code snippet:
Code Snippet Example of Parameter Mappings
const airbyteData = $input.first().json;

if (airbyteData && airbyteData.data) {
  return [
    {
      json: airbyteData.data,
    },
  ];
} else {
  return [];
}
This code snippet does the following:
Retrieves the Input:
$input.first().jsonaccesses the JSON payload sent by Airbyte.Checks for Data: It verifies that the
airbyteDataobject exists and contains adatafield.Maps the Data: If the
datafield exists, it creates a new object with the contents of thedatafield as itsjsonproperty.Returns the Result: The function returns an array containing the new data object. This ensures that the subsequent nodes in the workflow receive the extracted data.
By performing this mapping, you transform Airbyte's raw JSON payload into a structured data object that n8n can easily process. This webhook integration is fundamental to automating workflows based on real-time data changes. For more advanced workflows, consider exploring other capabilities of n8n, an open-source workflow automation tool, to tailor the data transformation and routing according to your specific needs.
With the webhook set up and data mapping configured, n8n is now ready to receive and interpret data from Airbyte, paving the way for automated actions based on database changes. The next step involves configuring Airbyte to send its CDC events to this webhook URL. You can learn more about workflow automation and related concepts in the AI Explorer section of our learning resources.
Step 3: Data Transformation & Enrichment in n8n
Now that our data is flowing from PostgreSQL to Airbyte, it's time to put on our data engineer hats and transform that raw data into something truly valuable. This is where n8n, a powerful workflow automation platform, shines, allowing us to clean, enrich, and structure the data before it lands in BigQuery.
Filtering INSERT and UPDATE Events
One of the first challenges is distinguishing between INSERT and UPDATE events coming from our PostgreSQL database. Airbyte streams all changes as data records, but we need to know what kind of change occurred. This is crucial for our BigQuery destination, as we might want to handle inserts and updates differently.
We can achieve this using n8n's Function and Set nodes. Think of the Function node as a JavaScript code block where we can write custom logic. We'll use it to inspect each incoming record and determine if it's an insert or an update based on the presence of specific fields or metadata.
Here's a simplified example of what the Function node's code might look like:
if ($json.data._airbyte_row_num === 1) {
  return [{json: {...$json, operation: 'insert'}}];
} else {
  return [{json: {...$json, operation: 'update'}}];
}
This code checks for a specific Airbyte metadata field (_airbyte_row_num). If it's present and equal to 1, we assume it's a new record (insert). Otherwise, we treat it as an update. We then add a new field called operation to the record, indicating whether it's an insert or update.
Next, we use a Set node to actually add or modify the fields in the data record. The Set node allows us to define new key-value pairs based on the output of the Function node. In this case, we're setting the operation field based on the logic in our JavaScript code.
By strategically using these nodes, we can effectively categorize each data record and prepare it for downstream processing.
Enriching Records with Timestamp Conversions
Often, raw data contains timestamps in formats that are not ideal for analysis. For instance, timestamps might be stored as Unix epoch seconds, which are not easily readable. Or, they might be in a timezone different from our target timezone. Data enrichment involves converting these timestamps into a more user-friendly and consistent format.
n8n allows us to perform these conversions with ease, again leveraging the Function node. We can use JavaScript's built-in date and time functions to parse the original timestamp and format it as a string in the desired timezone and format.
For example, to convert a Unix epoch timestamp to a human-readable ISO 8601 string in UTC, we might use the following code:
const epochSeconds = $json.data.timestamp;
const date = new Date(epochSeconds * 1000); // Convert seconds to milliseconds
const isoString = date.toISOString();

return [{json: {...$json, timestamp_utc: isoString}}];
This code takes the timestamp field from the input record, converts it to a JavaScript Date object, and then formats it as an ISO 8601 string. We then add a new field called timestamp_utc to the record, containing the converted timestamp. Using n8n, these powerful conversion features can easily be added to your data workflows.
Adding Metadata for Lineage and Auditability
In any data pipeline, it's crucial to maintain a clear understanding of where the data came from, how it was transformed, and when it was processed. This is known as data lineage and auditability. Adding metadata to each data record is essential for achieving this.
Using n8n, we can easily add metadata such as:
Source: The name of the source database or system.
Table: The name of the source table.
Pipeline: The name or ID of the n8n workflow.
Operation Type: As determined earlier, whether the record represents an
insertorupdate.Processing Timestamp: The time when the record was processed by the n8n workflow.
Again, the Set node is our friend here. We can define new fields with static values (e.g., the source database name) or dynamic values (e.g., the current timestamp). For the timestamp, we can use JavaScript to get the current time and format it as a string.
For instance, we might add the following metadata fields:
{
  "source": "PostgreSQL",
  "table": "users",
  "pipeline": "postgres-to-bigquery",
  "operation": "insert", // or "update"
  "processed_at": "2025-07-20T12:34:56Z" // Example timestamp
}
By consistently adding this metadata, we create a rich audit trail that makes it easier to track down data quality issues, understand data transformations, and comply with regulatory requirements.
Through filtering events, enriching records, and adding metadata, n8n transforms raw data into valuable insights. This prepped data is ready to be sent to BigQuery, which we'll cover in the next section.
Step 4: Loading Data into BigQuery
Now that our data is transformed and ready for consumption, we need to load it into BigQuery. Let's explore how to do this using n8n, a powerful workflow automation platform that lets you connect various apps and services.
Targeting Google’s InsertAll REST API
n8n's flexibility allows us to interact directly with Google's BigQuery API, specifically the InsertAll method. This is crucial for high-volume data ingestion. We'll use the HTTP Request node within n8n to target the following endpoint:
POST https://bigquery.googleapis.com/bigquery/v2/projects/[PROJECT_ID]/datasets/[DATASET_ID]/tables/[TABLE_ID]/insertAll
To make this work, you'll need to configure the HTTP Request node with the appropriate authentication. This usually involves setting up a Google Cloud service account and granting it the necessary permissions to write to your BigQuery dataset. Refer to Google's official documentation for the most up-to-date authentication procedures.
Crafting the Request Body for Batched Inserts
Instead of sending individual insert requests (which is highly inefficient), we'll leverage BigQuery's batched insert capability. This means sending multiple rows in a single API call. The request body needs to be structured as a JSON object with a "rows" array. Each element in the array represents a row to be inserted, and should contain a "json" object holding the actual data.
Here's an example of what the request body might look like:
{
  "rows": [
    {
      "json": {
        "user_id": 123,
        "event_type": "click",
        "timestamp": "2025-07-26T10:00:00Z",
        "page_url": "https://example.com/page1"
      }
    },
    {
      "json": {
        "user_id": 456,
        "event_type": "view",
        "timestamp": "2025-07-26T10:05:00Z",
        "page_url": "https://example.com/page2"
      }
    }
  ]
}
Your n8n workflow should dynamically build this JSON structure from the transformed data coming out of your previous transformation steps. This might involve using Function nodes or other data manipulation nodes within n8n.
Gracefully Handling API Rate Limits with Exponential Backoff
BigQuery, like any robust API, enforces rate limits to prevent abuse and ensure system stability. If you exceed these limits, your requests will be throttled, leading to data ingestion delays or failures. A key aspect of the n8n BigQuery integration is implementing a robust strategy for handling these rate limits.
The best approach is to use an exponential backoff strategy. This means:
If you receive a rate limit error (typically a 429 or 503 HTTP status code), wait a short period (e.g., 1 second).
Retry the request.
If the request fails again, double the wait time (e.g., 2 seconds).
Continue doubling the wait time with each subsequent failure, up to a maximum backoff time (e.g., 60 seconds).
n8n provides nodes like the "Wait" node and error handling mechanisms that allow you to easily implement this logic. The goal is to automatically retry failed requests with increasing delays, giving BigQuery time to recover and preventing your workflow from being overwhelmed. Some other tools like Zapier offer similar functionality.
Remember that monitoring your API usage and understanding BigQuery's rate limit policies is essential for preventing issues in the first place.
By carefully constructing the request body, targeting the correct API endpoint, and implementing robust error handling with exponential backoff, you can reliably load your transformed data into BigQuery using n8n. This ensures that your data warehouse is always up-to-date with the latest information from your PostgreSQL database, paving the way for insightful analysis and reporting. Next, we'll examine how to monitor the pipeline and ensure its ongoing health.
Step 5: Implementing Error Handling and Notifications
Even the most meticulously designed pipelines can stumble. Robust error handling and timely notifications are crucial for maintaining data integrity and pipeline stability. Let's fortify our PostgreSQL to BigQuery pipeline with these essential safeguards.
Implementing a Retry Mechanism
Transient failures – those fleeting glitches caused by network hiccups or temporary service unavailability – are a fact of life. Instead of letting these derail our entire pipeline, we'll implement a retry mechanism using n8n's Retry node. This allows the workflow to automatically attempt failed operations a set number of times.
Here’s how we can configure it:
Insert a Retry node immediately after the BigQuery insertion step. This node will catch any errors thrown by the BigQuery node.
Configure the Retry node to attempt up to 3 retries. This provides a reasonable balance between resilience and preventing indefinite looping.
Set a delay between retries. An exponential backoff strategy (e.g., 5 seconds, then 10 seconds, then 20 seconds) can be effective in giving the system time to recover.
By implementing a retry mechanism, we can automatically recover from transient errors without manual intervention, significantly improving the pipeline's reliability. This is especially important for scheduled tasks where immediate attention may not be possible.
Setting Up a Dead-Letter Queue (DLQ)
While a retry mechanism handles temporary setbacks, persistent failures require a different approach. A dead-letter queue (DLQ) acts as a safe haven for payloads that repeatedly fail to process. This prevents problematic data from clogging the pipeline and allows for later investigation and resolution. We'll use an SQS (Simple Queue Service) queue for this purpose.
Here's how to set it up:
Create an SQS queue in your AWS account. This queue will serve as the DLQ.
Configure the Retry node to send failed payloads to the SQS queue after the maximum number of retries has been exhausted.
Include relevant information in the SQS message, such as the original payload, the error message, and a timestamp. This will aid in debugging.
With a DLQ in place, we can isolate problematic data, prevent pipeline disruptions, and gain valuable insights into recurring failure patterns. We can later analyze the contents of the DLQ to identify and address the root causes of these failures. You may also be interested in other alternatives that could be found in our directory of AI Tools.
Configuring Slack Alerts
While automated error handling is essential, real-time notifications are critical for staying informed about the pipeline's health. We'll configure a Slack node to send alerts when payloads are pushed to the DLQ, indicating a more serious issue.
Here’s how to configure the Slack node:
Install the Slack app in your n8n instance and connect it to your Slack workspace.
Create a workflow that triggers whenever a message is added to the SQS dead-letter queue. The trigger can be an SQS trigger node.
Configure the Slack node to send a message to a dedicated Slack channel (e.g., #data-pipeline-alerts). The message should include details about the failed payload, the error message, and a link to the SQS queue for investigation.
Consider implementing throttling to prevent alert fatigue. For instance, you could set a rate limit on the number of alerts sent within a specific timeframe.
By integrating Slack alerts, we create a proactive monitoring system that notifies us of critical failures, allowing for timely intervention and preventing data loss. For similar needs, you might find value in tools listed in our AI News section, which often features insights on automation and monitoring.
Implementing robust error handling and notification mechanisms transforms our pipeline from a fragile process into a resilient and self-monitoring system. This proactive approach minimizes downtime, protects data integrity, and empowers us to address issues before they escalate.

Step 6: Adding Observability with Prometheus and Grafana
Real-time data pipelines are only as good as your ability to monitor them, and that's where observability comes in. By implementing robust monitoring, you can quickly identify bottlenecks, troubleshoot issues, and ensure your data pipeline is running smoothly. Let's explore how to add observability to our PostgreSQL to BigQuery pipeline using Prometheus and Grafana.
Implementing Prometheus Metrics with n8n
n8n, a powerful workflow automation platform, offers a Metric node that allows us to easily expose custom metrics in the Prometheus format. Think of Prometheus as a time-series database that collects metrics at regular intervals, and Grafana as a visualization tool that displays those metrics in informative dashboards. Here’s how to set up Prometheus metrics in n8n:
Add a Metric Node: Within your n8n workflow, insert a Metric node at a strategic point – ideally after the main data processing logic. This node will be responsible for collecting and exposing the metrics we want to monitor.
Configure the Metric Node: Configure the node to track key performance indicators (KPIs) such as:
Throughput: The number of records processed per second or minute. This metric gives you a clear picture of your pipeline's performance.
Error Rate: The percentage of records that failed to process correctly. Monitoring error rates is crucial for maintaining data quality.
Latency: The time it takes for a record to travel through the pipeline. High latency can indicate bottlenecks in your system.
Define Metrics: Use the Metric node to define custom metrics with appropriate names and labels. For example, you might define a metric called
records_processed_totalwith a label indicating the source system (PostgreSQL) and destination system (BigQuery).Expose the Metrics Endpoint: The Metric node automatically exposes a
/metricsendpoint on your n8n instance. Prometheus will scrape this endpoint periodically to collect the metrics data.
By strategically placing and configuring the Metric node, you gain real-time visibility into your data pipeline's health and performance. If you encounter challenges while setting up the N8N Metric node, consider leveraging AI tools like ChatGPT for quick assistance and troubleshooting.
Visualizing Throughput and Error Rate with Grafana
With Prometheus collecting our metrics, we can now create a Grafana dashboard to visualize the data. Grafana is an open-source data visualization tool that allows you to create interactive dashboards to monitor your systems. Here’s how to set up a Grafana dashboard for your data pipeline:
Add a Prometheus Data Source: In Grafana, add a new data source and configure it to connect to your Prometheus instance. This tells Grafana where to retrieve the metrics data.
Create a New Dashboard: Create a new dashboard in Grafana and add panels to visualize the metrics we defined in n8n.
Configure Panels: Configure the panels to display the following:
Throughput Chart: Create a time-series chart to visualize the throughput of your data pipeline over time. Use Prometheus queries to calculate the rate of records processed per second or minute.
Error Rate Chart: Create a chart to visualize the error rate of your data pipeline. Use Prometheus queries to calculate the percentage of records that failed to process correctly.
Latency Histogram: Create a histogram to visualize the latency of your data pipeline. This helps you identify performance bottlenecks and optimize your pipeline for speed.
Grafana Panel Configuration (JSON Export)
To make it easier to share and replicate your Grafana dashboard configuration, you can export the panel configuration as a JSON file. This allows you to quickly import the configuration into other Grafana instances or share it with your team. Here's an example of a JSON export for a simple throughput chart:
{
  "id": 1,
  "title": "Throughput (Records per Second)",
  "type": "graph",
  "datasource": "Prometheus",
  "targets": [
    {
      "expr": "rate(records_processed_total[1m])",
      "legendFormat": "Records/Second",
      "refId": "A"
    }
  ],
  "xAxis": {
    "format": "time"
  },
  "yAxes": [
    {
      "format": "short",
      "label": "Records/Second"
    },
    {
      "format": "short"
    }
  ]
}
This JSON configuration defines a graph panel that displays the rate of records processed per second, using data from the
records_processed_totalmetric in Prometheus. This allows for easy duplication and transfer of dashboard configurations.
By implementing Prometheus and Grafana, you create a powerful observability layer for your real-time data pipeline. You can now monitor the pipeline's health, identify bottlenecks, and ensure data quality, leading to a more reliable and efficient data integration process. To stay ahead of the latest advancements in AI-driven monitoring and data pipeline optimization, be sure to check out the AI News section regularly.
Step 7: Cost-Tracking & Optimization
Maintaining a cost-effective data pipeline is crucial for long-term sustainability. Here's how to track and optimize costs within our PostgreSQL to BigQuery pipeline.
Monitoring Google Cloud Billing
The first step is to actively monitor your Google Cloud Billing account. Google Cloud provides detailed billing reports that break down costs by service, project, and even individual API calls. To effectively track expenses:
Filter by Service: Focus on the BigQuery service to isolate costs associated with data storage, processing, and API usage.
Analyze API Calls: Pay close attention to the costs associated with specific BigQuery API calls, like
query,insert, andload. This will help you understand which operations are driving up costs.Track Data Volume: Monitor the amount of data ingested, processed, and stored in BigQuery. Optimizing data volume can lead to significant cost savings.
Regularly reviewing these reports helps identify cost spikes and areas where optimization efforts can be focused. For example, you might discover that a particular query is consuming a disproportionate amount of resources.
Logging Daily Metrics with n8n
To gain even more granular insights, we can use n8n, a powerful workflow automation tool, to log daily metrics to a Google Sheet. This involves creating an n8n workflow that:
Queries Google Cloud Billing API: Use the Google Cloud Billing API to fetch daily cost data for BigQuery.
Extracts Relevant Metrics: Parse the API response to extract key metrics like total cost, data volume processed, and number of API calls.
Uses Spreadsheet Node: Employ n8n's Spreadsheet node to append these metrics to a Google Sheet.
By automating this process, you'll have a readily available dataset for tracking cost trends over time. This is particularly useful in low-code data pipelines where you want to quickly visualize trends without complex scripting.
Visualizing Cost Trends
With the daily metrics logged in Google Sheets, creating a visualization becomes straightforward. I recommend building a simple chart template that visualizes monthly cost versus events processed. This chart helps you:
Identify Correlations: Observe the correlation between the number of events processed and the associated costs. This can highlight inefficiencies in your data pipeline.
Detect Anomalies: Spot any unusual spikes in cost or data volume that warrant further investigation.
Measure Optimization Impact: Track the impact of optimization efforts on cost reduction over time.
A well-designed chart template provides a clear, visual representation of your pipeline's cost performance, enabling you to make data-driven decisions for optimization.
Cost tracking and optimization are ongoing processes that require continuous monitoring and analysis. Regularly review billing reports, analyze logged metrics, and refine your pipeline to achieve maximum cost efficiency. By leveraging tools like n8n and Google Sheets, you can gain the visibility needed to effectively manage and optimize your PostgreSQL to BigQuery data pipeline. To learn more about automation, check out our AI News section for the latest trends.

Conclusion & Next Steps: Mastering Real-Time Data Pipelines
So, there you have it: a fully functional, real-time data pipeline that seamlessly syncs your PostgreSQL data to BigQuery using the combined power of Airbyte and n8n, a flexible workflow automation platform. This pipeline isn't just about moving data; it's about unlocking new insights, making data-driven decisions faster, and empowering your team to focus on what matters most.
Advantages of This Pipeline: A Quick Recap
Let's quickly revisit the key benefits of the real-time data pipeline we've built. It offers:
Real-time data synchronization: Stay up-to-date with the latest information from your PostgreSQL database in BigQuery.
Automated data transformation: Clean and transform your data on the fly, ensuring data quality and consistency.
Scalability and reliability: Handle large volumes of data with ease and confidence.
Customizable workflows: Adapt the pipeline to your specific needs and requirements. The flexibility of n8n allows you to adjust the workflow to fit your exact data transformation logic.
Cost-effectiveness: Optimize your data infrastructure and reduce manual effort.
By automating the flow of data, this pipeline eliminates the bottlenecks and inefficiencies often associated with traditional ETL processes. You gain a competitive edge by accessing and analyzing data in real time. This is crucial for making timely decisions and responding quickly to changing market conditions.
Get Your Hands on the Code: Downloadable Resources
We want to make it as easy as possible for you to implement this pipeline in your own environment. That's why we're providing you with the following resources:
Full Workflow JSON: Download the complete n8n workflow JSON file, ready to be imported into your n8n instance. This gives you a head start in setting up your data pipeline.
Docker Compose File: Get the Docker Compose file to quickly deploy Airbyte, n8n, and PostgreSQL with a single command. Streamlining the deployment process saves you time and effort.
These resources are designed to help you quickly get up and running with your real-time data pipeline. Feel free to customize them to fit your specific needs and explore the possibilities of automated data synchronization.
Ready to Scale? Join Our Live Workshop
Building a data pipeline is just the first step. To truly harness the power of real-time data, you need to ensure your infrastructure can handle the load. We invite you to sign up for our live workshop on "Scaling n8n for Data-Intensive Workloads." In this workshop, you'll learn:
Best practices for optimizing n8n performance.
Strategies for handling large volumes of data.
Advanced techniques for scaling your n8n workflows.
Real-world examples of successful data pipeline implementations.
Don't miss this opportunity to take your data pipelines to the next level. Our experts will guide you through the intricacies of scaling n8n and provide you with the knowledge and tools you need to succeed. By mastering the concepts of real-time data pipelines, you can unlock new insights and stay ahead in today's data-driven world.
Keywords: Airbyte n8n real-time sync, n8n BigQuery integration, Postgres CDC n8n tutorial, real-time data pipeline, change data capture (CDC), data synchronization, low-code data pipelines, n8n workflow automation, Airbyte data connector, BigQuery data warehousing, PostgreSQL CDC, data transformation, data enrichment, webhook integration, error handling
Hashtags: #n8n #Airbyte #DataPipelines #RealTimeData #BigQuery
For more AI insights and tool reviews, visit our website https://best-ai-tools.org, and follow us on our social media channels!
Website: https://best-ai-tools.org
X (Twitter): https://x.com/bitautor36935
Instagram: https://www.instagram.com/bestaitoolsorg
Telegram: https://t.me/BestAIToolsCommunity
Medium: https://medium.com/@bitautor.de
Spotify: https://creators.spotify.com/pod/profile/bestaitools
Facebook: https://www.facebook.com/profile.php?id=61577063078524
YouTube: https://www.youtube.com/@BitAutor